When running Docker Swarm and plenty of Docker nodes and containers instead of a single Docker node, there are some challenges when it comes to uptime and performance monitoring. Its not just about the cluster functionality, its about the deployment as well, when it comes to individual node metrics.
This blog post explains how to setup Docker Swarm monitoring, the deployment and setup of the following components to collect as many vital metrics as possible:
- cAdvisor
- Node Exporter
- Dockerd Exporter
To collect all the data, we install a prometheus service as well.
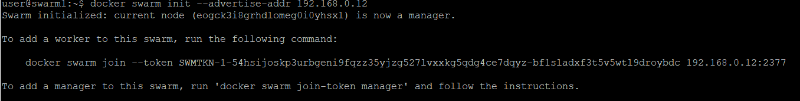
Let’s assume we run a Docker Swarm cluster of 3, that has been setup as described in the last blog post:
https://www.opvizor.com/install-and-use-docker-swarm
As we don’t want to run all container using the docker service command, we build a docker-compose file step by step, to have a complete deployment file to start our Docker Swarm monitoring.
The important part when deploying any of the monitoring components is that they need to run on all nodes within the swarm to allow full visibility.
Therefore, we create the cross-node networks and services and make sure that they are deployed on each node if required (setting deploy: mode: global).
Let’s start creating a docker-compose.stack.yml and create the overlay network (accessible across nodes), a volume for our future prometheus data and a config for our prometheus and a config for the Dockerd service we create at the end.
Furthermore, we use the Docker Swarm configs for an entrypoint script for our node exporter. That way we can use the smart way of Stefan Prodan to collect Swarm node metadata without changing the container image itself (so we can stick to the always updated original Prometheus Node Exporter).
version: "3.3"
networks:
net:
driver: overlay
attachable: true
volumes:
prometheus: {}
configs:
dockerd_config:
file: ./dockerd-exporter/Caddyfile
prom_conf:
file: ./prometheus/conf/prometheus.yml
node_exporter_entrypoint:
file: ./node-exporter/docker-entrypoint.sh
services:
Deploying cAdvisor
cAdvisor (Container Advisor) provides container users an understanding of the resource usage and performance characteristics of their running containers. It is a running daemon that collects, aggregates, processes, and exports information about running containers. Specifically, for each container it keeps resource isolation parameters, historical resource usage, histograms of complete historical resource usage and network statistics. This data is exported by container and machine-wide.
cAdvisor has native support for Docker containers and should support just about any other container type out of the box. We strive for support across the board so feel free to open an issue if that is not the case. cAdvisor’s container abstraction is based on lmctfy‘s so containers are inherently nested hierarchically.
If you want to learn more about cAdvisor:
https://github.com/google/cadvisor
Add the cadvisor service to your docker-compose.stack.yml
cadvisor:
image: google/cadvisor
networks:
- net
command: -logtostderr -docker_only
volumes: - /var/run/docker.sock:/var/run/docker.sock:ro
- /:/rootfs:ro
- /var/run:/var/run
- /sys:/sys:ro
- /var/lib/docker/:/var/lib/docker:ro
deploy:
mode: global
resources:
limits:
memory: 128M
reservations:
memory: 64M
Deploying Node Exporter
The next service we want to add is the Node exporter, that exposes additional metrics.
https://hub.docker.com/r/prom/node-exporter/
As we haven’t created the entrypoint config file yet, that will be loaded into the Docker Swarm configs, we need to create that now.
mkdir node-exporter
vi docker-entrypoint.sh# file content:#!/bin/sh -eNODE_NAME=$(cat /etc/nodename)
echo "node_meta{node_id="$NODE_ID", container_label_com_docker_swarm_node_id="$NODE_ID", node_name="$NODE_NAME"} 1" > /home/node-meta.promset — /bin/node_exporter "$@"exec "$@"
That script collects the local node information and creates a metadata file that will be picked up by the node exporter service for Prometheus to scrape:
–collector.textfile.directory=/home/
Later on Prometheus will store node_meta information as well:

Let’s add the node exporter service to your docker-compose.stack.yml (make sure to keep the alignment in place, so all services like cadvisor and exporter start at the same position).
Important: never use tab spaces in yaml files
node-exporter:
image: prom/node-exporter:latest
networks:
- net
volumes: - /sys:/host/sys:ro
- /:/rootfs:ro
- /proc:/host/proc:ro
- /etc/hostname:/etc/nodename
configs: - source: node_exporter_entrypoint
target: /docker-entrypoint.sh
deploy:
mode: global
environment: - NODE_ID=
command: - ‘–path.procfs=/host/proc’
- ‘–path.rootfs=/rootfs’
- ‘–path.sysfs=/host/sys’
- ‘–collector.filesystem.ignored-mount-points=^/(sys|proc|dev|host|etc)($$|/)’
- ‘–collector.textfile.directory=/home/’
- ‘–no-collector.ipvs’
entrypoint:- /bin/sh
- /docker-entrypoint.sh
Deploying Dockerd Exporter
The Docker Daemon exporter exposes Docker swarm metrics as well and its required to enable that option (experimental) and we’re going to use a specific container to expose the prometheus metrics for our Prometheus server.
https://github.com/stefanprodan/dockerd-exporter
The easiest way to enable that is to change or create the file /etc/docker/daemon.json and add the following content and restart the docker service.
{
"metrics-addr" : "0.0.0.0:9323",
"experimental" : true
}
We need to create the configuration file as well for our service:
./dockerd-exporter/Caddyfile
:9323 {
proxy / {$DOCKER_GWBRIDGE_IP}:9323 {
transparent
} errors stderr
tls off
}
Then we can add our Caddy service to expose Port 9323 metrics to our Prometheus service discovery. Before adding it make sure, that your docker Gateway bridge reflects the IP address in the service description. Therefore please run to make sure its 172.18.0.1 as in the example or change the value accordingly:
docker run –rm –net host alpine ip -o addr show docker_gwbridge
add the dockerd exporter service to your docker-compose.stack.yml
dockerd-exporter:
image: stefanprodan/caddy
networks:
- net
environment: - DOCKER_GWBRIDGE_IP=172.18.0.1
configs: - source: dockerd_config
target: /etc/caddy/Caddyfile
deploy:
mode: global
resources:
limits:
memory: 128M
reservations:
memory: 64M
Deploying Prometheus
Now that all required exporter services are in our docker-compose file, lets add the Prometheus server now to make the collector agent and service part complete.
First we need to make sure to have a valid prometheus.yml configuration in the prometheus/conf directory.
global:
scrape_interval: 15s
evaluation_interval: 15s external_labels:
monitor: ‘prommon’scrape_configs:
- job_name: ‘prometheus’
static_configs:- targets: [‘localhost:9090’] – job_name: ‘dockerd-exporter’
dns_sd_configs:- names:
- ‘tasks.dockerd-exporter’
type: ‘A’
port: 9323 – job_name: ‘cadvisor’
dns_sd_configs:- names:
- ‘tasks.cadvisor’
type: ‘A’
port: 8080 – job_name: ‘node-exporter’
dns_sd_configs:- names:
- ‘tasks.node-exporter’
type: ‘A’
port: 9100
- targets: [‘localhost:9090’] – job_name: ‘dockerd-exporter’
Then we need to add the Prometheus service to Docker Swarm Monitoring stack our docker-compose.stack.yml file.
prometheus:
image: prom/prometheus
networks:
- net
ports: - "9090:9090"
command: - ‘–config.file=/etc/prometheus/prometheus.yml’
- ‘–storage.tsdb.path=/prometheus’
- ‘–storage.tsdb.retention=${PROMETHEUS_RETENTION:-24h}’
volumes: - prometheus:/prometheus
configs: - source: prom_conf
target: /etc/prometheus/prometheus.yml
deploy:
mode: replicated
replicas: 1
placement:
constraints:- node.role == manager
resources:
limits:
memory: 2048M
reservations:
memory: 128M
- node.role == manager
Now we can start everything at once as a stack called docker-swarm-monitor:
docker stack deploy -c docker-compose.stack.yml docker-swarm-monitor
You can check the stack and the services using docker stack ls and docker service ls
To remove our deployment simply run docker stack rm docker-swarm-monitor
If you should run into any issues that services are not starting, its always recommended to check the logs first. The easiest way to do that is using the service name, i. e. docker service logs -f docker-swarm-monitor-prometheus
Especially when copy/paste files from websites the format can get messed up.
Prometheus Scraping
Everything has been set up now and the services has been started. The next thing to check is the automatic scraping of Prometheus, so metrics are getting collected. Just visit your Swarm cluster ip on Port 9090:
and if the data is really there, creating a simple Prometheus graph
Visualization
The next step would be to run a Grafana service as well and import or create dashboards.
If you run Performance Analyzer, you can just connect your Prometheus datasource and ask us for the dashboards to import.
That whole project can be found on github as well, so you can directly get started and run a full Docker Swarm monitoring stack with a simple docker stack command instead of copy the examples here. Just do a git clone https://github.com/opvizordz/docker-swarm-monitor.git